


History,Philosophy,Basic Tenets of Technical Analysis
Technical Analysis is a study of the past price action to predict the future price Trends. This means that the price of a share tells us as to how the share is going to move in the future and any reasons , let it be Fundamental or Technical, that could lead to a rise or a fall in the share prices is reflected in the price of that share. To give a simple example if a company is going to post excellent results, this will be reflected in the share price with a good rise which will be on account of insider buying. Similarly the opposite of this also is true. What we saw above was a fundamental factor responsible for the movement in the share prices. Besides these Fundamental factors there are Technical Factors viz. the Laws of Demand & Supply which also could lead to sharp movements in the share prices. These factors work on Mass Psychology and are closely linked to the Human Mind. Under a given set of circumstances all minds tend to work in the same direction. The theories of Technical Analysis are based on this concept and hence the share price movements can be predicted more often than not based on these theories.
Hence Technical Analysis is a subject which can successfully identify the beginning of a sharp rise or fall in the share prices. However, it is incorrect to say that Technical Analysis can predict or forecast all the moves correctly, as at certain times the markets itself are undecided.
Though Technical Analysis is being practiced in the West as well as some Asian countries like Japan for more than past 100 to 150 years, it has become popular in India only in the last 15 to 20 years.
To sum it up Technical Analysis:
- Is based on the law of Demand and Supply.
- Works best in stocks that have a mass following.
- Depicts the mindset of masses i.e. mass psychology.
The basic difference between Technical Analysis and Fundamental Analysis is that FA tries to find reasons for a stock to move up or down and based on the reasons predicts the price movements whereas TA is not concerned with the reasons and it believes that the way a stock price moves currently tells you where it is heading for in the future.
Advanatges & Limitations of Technical Analysis
- It is independent of any news or occurrence of events as any of these are reflected in the stock price.
- Most of the Fundamental information such as announcement of Results or any other which affects the price of a share reaches a common Investor the last but an Investor following TA can get early signals based on price movements though he may not know the exact nature of information.
- Since TA is based on Mass Psychology which can change and is fluctuating at times, Technical Analysis recommends use of Stop-losses which if strictly implemented can save Traders and Investors from a much bigger loss in the future.
Limitations of Technical Analysis
- If not backed by proper study of Fundamentals, TA cannot distinguish between small moves and big moves as well as Stocks that move on support of masses and stocks that are manipulated by a few individuals or groups or so called Operators.
- Many a times Stop-Losses based on Technical Analysis get triggered in choppy market conditions and the price moves back to its original level or as expected.
TECHNO - FUNDA - The Best Approach
Ideally one should use a combination of both Fundamental Analysis as well as Technical Analysis to decide on an Investment strategy. Fundamental Analysis should be used to spot stocks which have a potential to rise and Technical Analysis should be used to determine the timing i.e. the entry and exit levels.
Chart Construction
The X-axis on a chart plots the periods for which prices are plotted and the Y-axis plots the value or the price of the share. This could range from a few hours to a few years. This means that prices can be plotted based on the prices that range from hours to years. Thus we could have minute charts as well as hourly, daily, weekly, monthly, quarterly, yearly charts based on the above data.
Short Term Traders trade on the basis of daily charts as they are more interested in the immediate movement in the stock prices, whereas Medium term to Long term Traders are more dependent on weekly / monthly charts as they want more returns for which they are prepared to wait for a longer duration.
There are 3 types of charts which are commonly used by chartists. These are
- Line charts: The closing prices are plotted on the graph and are joined to form a line.
- Bar Charts: The Bar uses open / high / low / close for the session.
- Candlestick Charts: Also use open / high / low / close for the session.
The 4 quotes that are used to construct a Bar Chart or a Candlestick chart are in the order of Open / High / Low / Close
Line Charts
Bar Charts
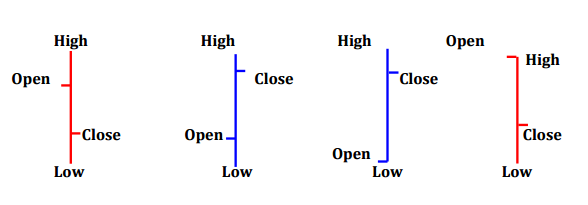
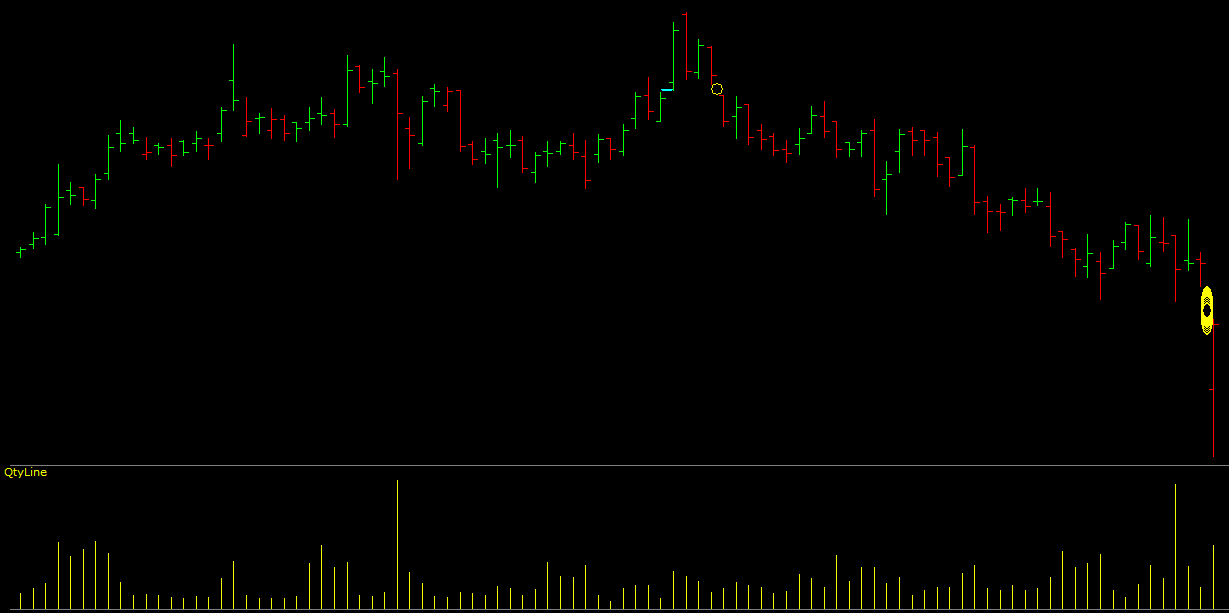
In a Bar chart the open is indicated by a small hash (-) which is drawn on the left side of the Bar and the close by another hash on the right side of the bar.
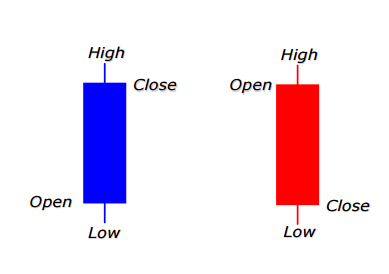
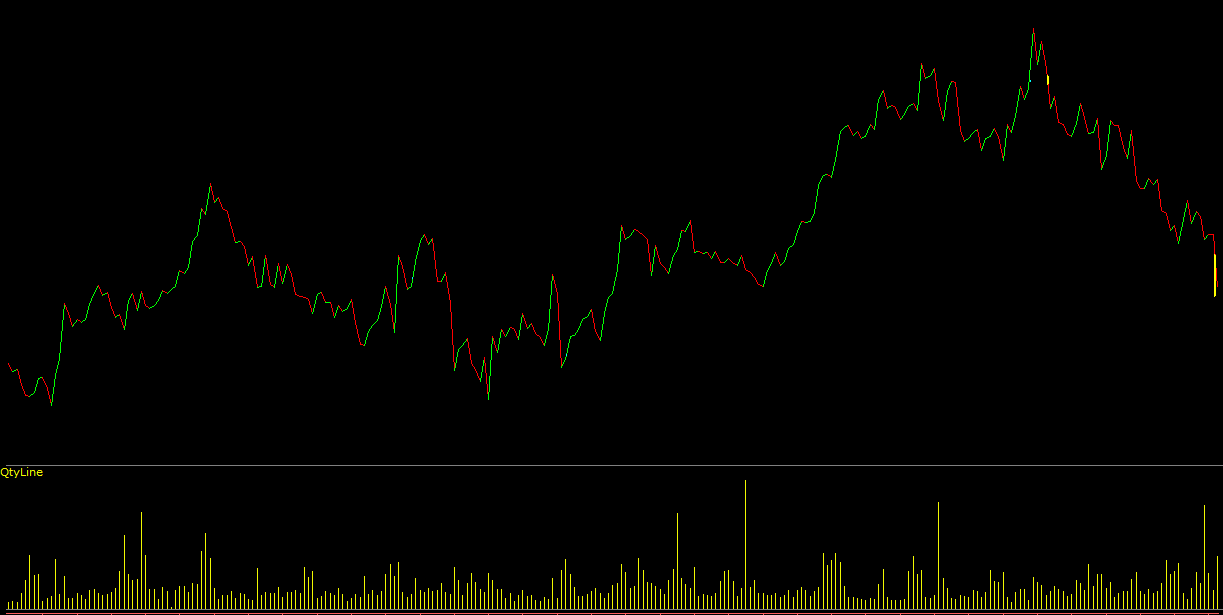
CandleStick Charts
In a Candlestick chart the real body i.e. the 2 ends of the body, show the opening and the closing price for the given period. The lines at the top and bottom of the real body are called the shadows and they denote the high and the low for that session. The rectangle is called as the real body of the candle and it denotes the open and the close. The colour of the body denotes the open and the close of that session. If the open to close is on the higher side i.e. it is a bullish candle and vice versa if the close is lower than the open it is a bearish candle. Generally the colors used to denote bullish candles are white, green or blue and the bearish candles are red or black.