


Theory of Support and Resistance
A stock is said to have taken Support at a price level when in a downward move, it stops and moves in the upward direction. Vice-versa a stock is said to have taken Resistance at a price level when in an upward move, it stops and moves in the downward direction.
Ideally in an Uptrend one should buy or go long on every fall at a significant support level and in a Downtrend one should sell or go short on every rise at a significant resistance level.
Following are the tools for Support and Resistance.
- Previous Significant Highs and Lows
- Trendlines
- Retracement Levels
Significant highs and lows are those levels from where the markets have moved up or have fallen down sharply in the past. When the stock prices test these levels anytime in the future, they will act as strong support and resistance levels.
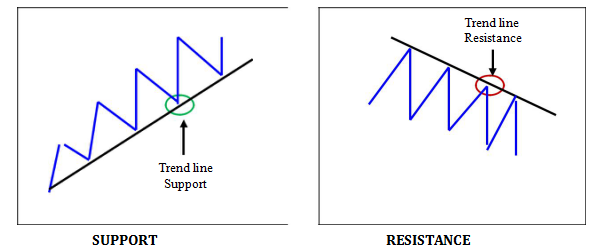
A Trend line is another excellent tool which gives us important Support and Resistance levels. A trendline is a line joining 2 or more significant highs or lows or 2 important prices, which gives important support and resistance levels.
Basic Rules for drawing Trendlines
- Trendlines are lines drawn by joining 2 significant points on the chart.
- The angle of a good Trendline should be from 0 to 45 degrees.
- Support is when a share price touches a Trendline and moves up.
- Resistance is when a share price touches a Trendline and moves down.
- One should Buy when the price takes support on the Trendline and moves up & Sell when the price meets with resistance at a Trendline and moves down.
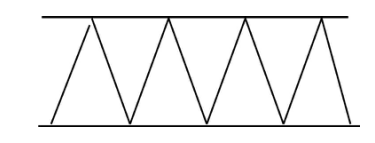
- Channel Lines are 2 parallel lines within which the price of a share moves in a sideways trend. They are very effective in a sideways market and also when the trend changes from sideways to either direction.
Retracement is the correction that occurs in the price of a share. In a falling market the retracement will be in the upward direction and in a rising market it will be in the downward direction.
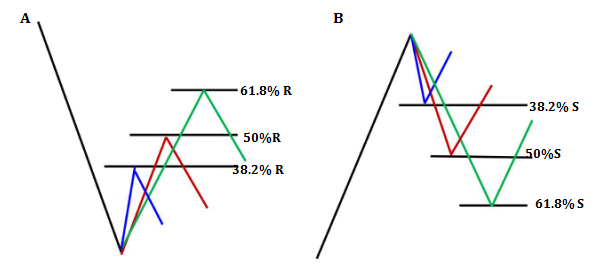
Normally it is seen that 38.2 %, 50 % and 61.8 % are good retracement levels and the markets have a tendency to take support in case of an uptrend and face resistance in case of a downtrend at or around these levels. These levels also give an indication of the current trend or a likely change in the same. Although the retracement levels work more often than not, there could be times where the prices may move beyond the normal retracement levels.
Consolidation is a process where the prices move sideways or in a range before a big move is likely to commence. It is like that the market is taking a breather before a big move is about to commence. The move after consolidation is normally in the direction of the prevailing trend.