


RSI / Stochastics
Oscillators or momentum indicators as that are called at times give an advance indication of change in trend. Oscillators are drawn along with the price to spot signals.
Some Commonly used Oscillators are
- RSI (14 E 9) -Relative Strength Index
- STOCHASTICS (% K 5, % D 3, E 3)
- MACD (9 24 E 9) - Moving Average Convergence Divergence)
The most common of the above is the RSI and the Stochastics. Between these two, many traders prefer the Stochastics as it is smoother and does not turn too often. Also it helps spot smaller moves. MACD gives good signals but late signals.a.
Stochastics (% K 5, % D 3, E 3)
The 2 dotted lines are the overbought and oversold zones.
The Oscillator has 2 lines. One is the Oscillator line and the other is the trigger line.
When the Oscillator goes above the overbought zone, it means that a lot of buying has taken place and that a downward correction may be overdue. Similarly when the Oscillator goes below the oversold zone, it means that a lot of selling has taken place and that an upward correction may be overdue.
The overbought and oversold zones are normally 70 and 30 in the RSI and 75 and 25 in the Stochastics. However, they are indicative and can be changed as per the stock as well as the market conditions.
Negative & Positive Divergence
Signals based on the Oscillators
1. Divergence
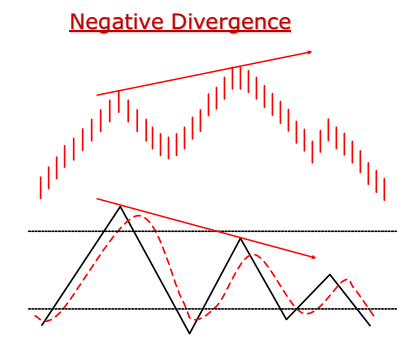
Sell in the overbought zone when there is a Negative Divergence between the price and the Oscillator. I.e. the price making a higher top but Oscillator making a lower top.
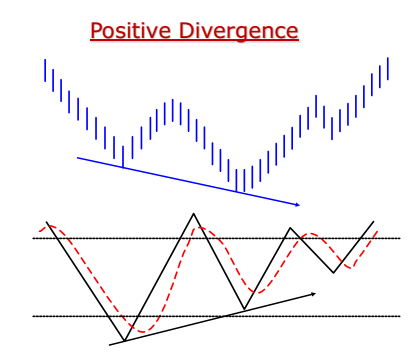
Buy in the oversold zone when there is a Positive Divergence between the price and the Oscillator. I.e. the price making a lower bottom top but Oscillator making a higher bottom.
Overbought & Oversold zones
2. Crossover
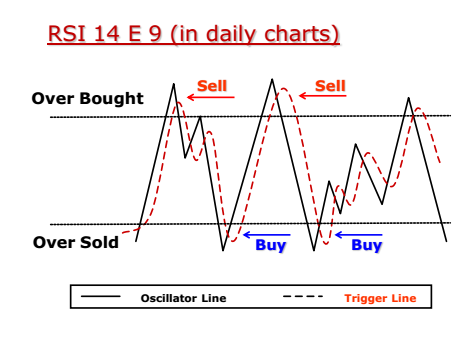
Buy in the overbought zone when the Oscillator line cuts the trigger line from below on the first day.
or
Sell in the overbought zone when the Oscillator line cuts the trigger line from above on the first day.
An Oscillator gives early signals but it also gives many whipsaws (false signals). To avoid this it should be used along with patterns and other indicators and not in isolation.