Market Discount Everything
Charles H. Dow after whom the “Dow Jones” Wall Street index in named is the founder of many theories and his contribution to the theory of Technical Analysis is immense. Even after so many years what he propagated is still valid and he is rightly termed as the “Grandfather” of Technical Analysis.
Definition Of Trend
Dow defines Trend as the direction in which the market moves. Based on the same we have:
- An Uptrend
- A Downtrend
- A Sideways Trend
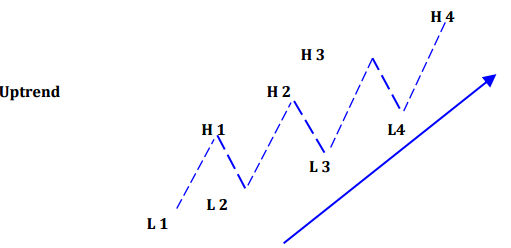
In an Uptrend the share prices move in the upward direction making new highs in the process. Hence the best indication of an Uptrend is the prices making a higher top – higher bottom.
As seen above prices make a higher top as well as a higher bottom and one should try and buy on every correction in an uptrend.
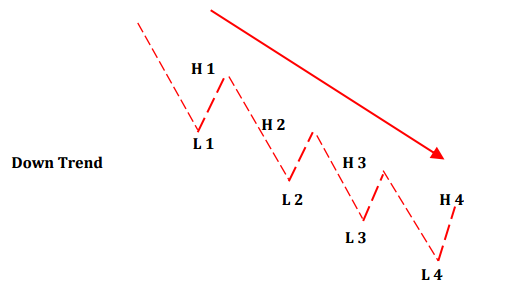
In a Downtrend the share prices move in the downward direction making new lows in the process. Hence the best indication of a downtrend is the prices making a lower top – lower bottom.
As seen above prices make a lower high as well as a lower low and one should try and sell on every rise.
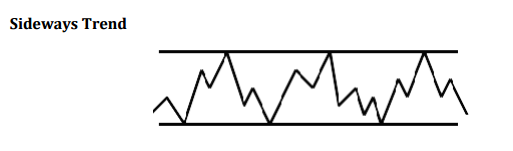
In a Sideways trend the share prices move in a narrow band , neither going upward nor downward. One should wait for a cleat cut breakout and not trade in a sideways trend.
Dow has also defined Trend in terms of time, viz.
| Primary (Major) |
- |
1 to 3 years |
| Secondary (Intermediary) |
- |
6 to 12 months |
| Minor |
- |
3 to 6 months |
However, a trader should decide his own trading timeframe and accordingly decide which charts to use.
Time frame validity of different charts
Time frame validity means the time frame for the signals spotted in the charts of different durations hold good. Normally a signal spotted is valid for around 5 to 8 times of its duration. This means that a signal in a daily chart is valid for the next around 5 to 8 days, and the expected move should begin in that time frame.
Daily Charts
At the End Of Day
Short Term (4-6 Days)
Weekly Charts
At the End of Week
Medium Term (4-6 Weeks)
Monthly Charts
At the End Of Month
Long Term (4-6 moths)
Intraday(60 mins)
During The Day
Short Term (1-2 Days)
Intraday(30 mins)
During The Day
Intraday Trades (2-3 Hrs)
Importance of Volumes
Volumes lead prices. If prices start moving up on high volumes, there is a very good chance that this rise will be sustained. However, it very important to understand where the volumes have occurred and the price movement that that has taken place along with the volumes.
Broadly one can conclude that:
Price Action
Interpretation
Price Rise With High Volumes
Bullish
Price Rise With Low Volumes
Not So Bullish
Price Fall With High Volumes
Bearish
Price Fall With Low Volumes
Not So Bearish
Though the above is true and applicable in normal situations, there are some exceptions and at extreme points i.e. at highs where the prices have already moved up sharply and at lows when the prices have fallen sharply this logic may not work.
Hence, if one sees a good price rise at an important bottom with a significant rise in volumes, one can go long. However, one must take the average volume for the past 5 to 8 sessions and not for just one session as that can lead to a whip-saw (false signal).
High volumes at significant Bottoms and Breakouts normally indicate the Trend. However prices can fall on not so high volumes and hence at significant market tops one may not always see high volumes which may follow later. However, breakouts or breakdowns which indicate a further continuation of a move have to be normally accompanied by high volumes.