


Continuation Patterns
Patterns are formations on charts which can be identified by a set of similar characteristics which occur time and again. Patterns reflect the mindset of the masses at that point of time and work very well in trended markets.
Continuation Patterns are patterns which occur in continuation of a move. They show the continuation of the trend. Needless to say that one can get an entry when a part of the move is already over and not at the beginning of a move. The best thing about continuation patterns is that, once the pattern is confirmed these patterns give a sense of the targets in terms of price as well as time and they work accurately most of the times. Though one gets an entry based on a continuation pattern not exactly at the beginning of a move, the targets come very fast in most of the continuation patterns.
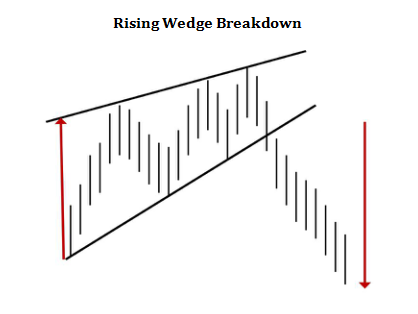
Rising Wedge: A Wedge is a sloping triangle. In case we have a break down from an upward sloping triangle it is termed as a rising wedge. All the other properties of triangles remain the same for a Rising Wedge. A Rising Wedge at or near the market top is very bearish and a sharp decline in the prices is likely once the prices break down from the rising wedge.
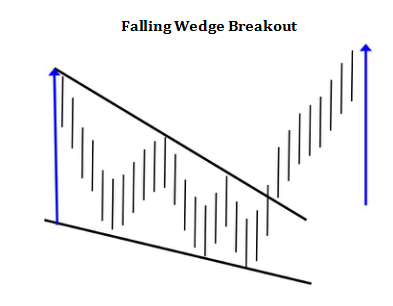
Falling Wedge: In case we have a breakout from a downward sloping triangle it is termed as a Falling Wedge. All the other properties of triangles remain the same for a Falling Wedge. A Falling Wedge at or near the market bottom is very bullish and a sharp rally in the prices is likely once the prices break out from the rising wedge.
Head & Shoulders Pattern
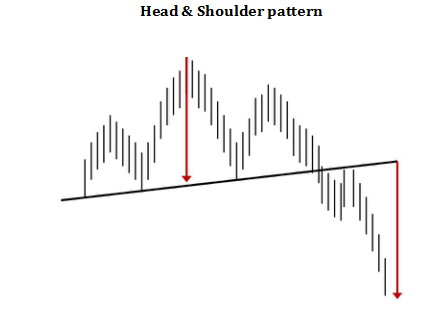
This pattern resembles the anatomy of the human body. I.e. two shoulders and the head with the head placed on the two shoulders. Head & Shoulders pattern occurring at a market top is a strong downward reversal pattern. The Trend line joining the two shoulders and the head is termed as the neckline.
The target after the breakdown and the pullback, in case there is one, is equal to the length measured from the neckline to the top of the head. The same length is measured downside from the neckline level or the pull back towards the neckline, whichever is higher. The target of price movement of C to D in the diagram shown below is equal to the price movement of A to B. Head and Shoulders pattern at significant market tops can lead to trend reversal from bullish to bearish and as such is also termed as a reversal pattern.
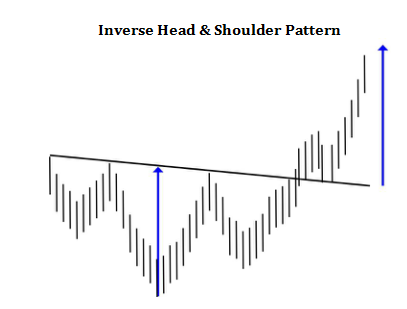
The Inverse Head & Shoulder pattern is exactly opposite of the Head & Shoulders pattern and occurs at market bottoms. The Inverse H & S is an upward reversal pattern. The Trendline joining the two shoulders and the head is termed as the neckline.
The target after the breakout and the pullback, in case there is a pull back, is equal to the length from the neckline to the bottom of the head. The target of price movement of C to D in the above case is equal to the price movement of A to B. Inverse Head & Shoulders pattern at significant market bottoms can lead to a trend reversal from bearish to bullish and as such is also termed as a reversal pattern.
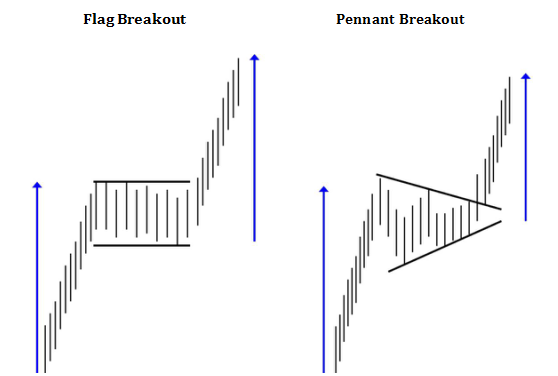
Flags / Pennants
Flags & Pennants appear in the continuation of a move. Normally after a steep rally or a fall the markets pause momentarily or consolidate before the move begins again in the same direction.
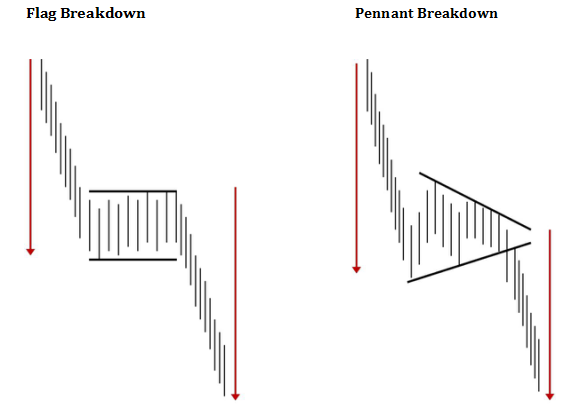
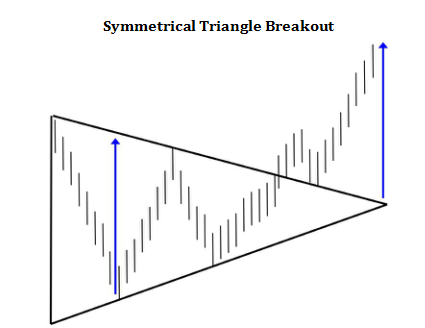
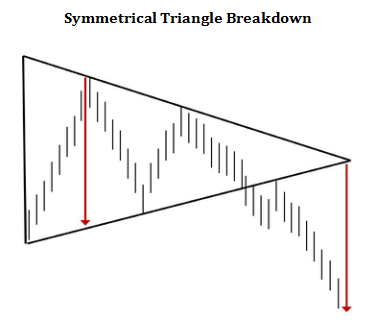
The difference between a flag and a pennant is that, in a flag there is a rectangle and in a pennant there is a triangle after the flagpole which resembles the sharp rally or the fall before the consolidation.
The targets for both patterns are measured similarly. The length of the flagpole is replicated once the breakout or the breakdown occurs and the target measured from the breakout / breakdown point is equal to the length of the flagpole.