


The Japanese have been using candlesticks since around 3 centuries and traders were using the same to trade in rice and paddy. Candlestick patterns have become popular in the West and then in India in the last 20 to 25 years and they provide a lot of variety in charting. Though there are hundreds of candlestick patterns, the primary patterns are important and keep repeating time and again and also work very effectively in our markets.
We will cover the bullish patterns at market bottoms and the corresponding bearish patterns at market tops.
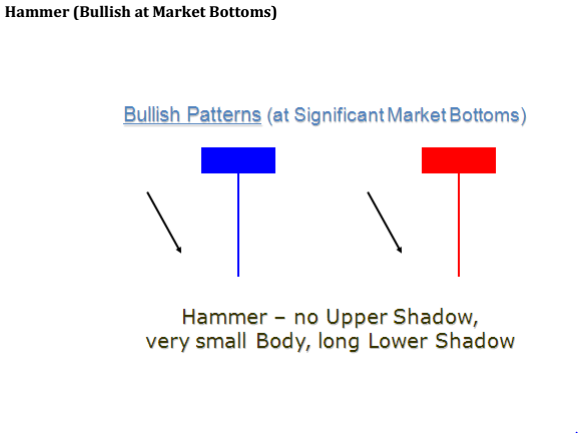
Hammer
Shooting Star / Inverse Hammer
Shooting Star
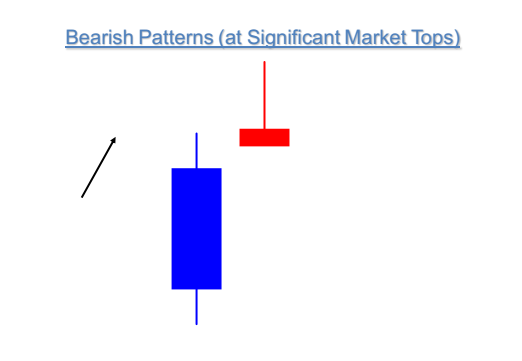
Shooting Star (Bearish at Market Tops) - Resembles an Inverted Hammer but appears after a big bullish candle with a gap between the two bodies
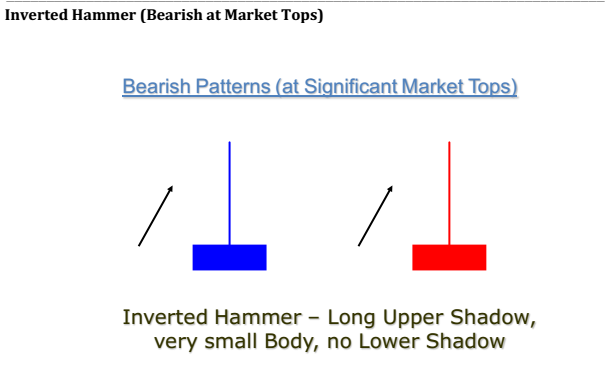
Inverted Hammer
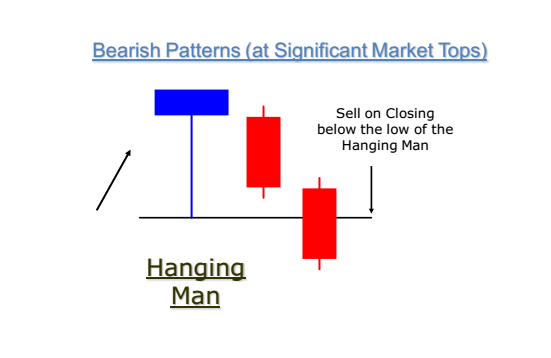
Hanging Man
Hanging Man (Bearish at Market Tops) -Only on confirmation of the low of the hammer being broken on a closing basis
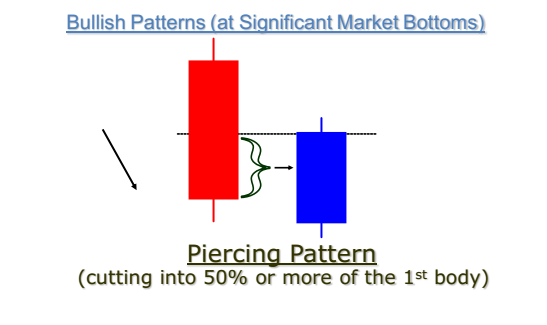
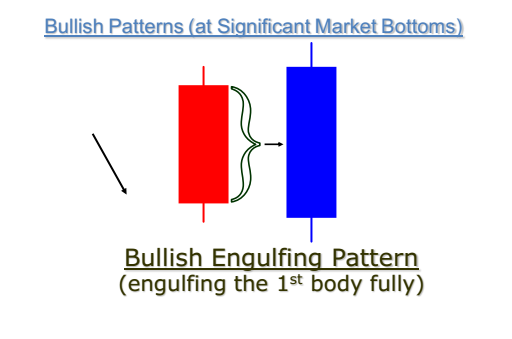
Piercing Pattern / Engulfing Bullish Pattern
Piercing Pattern
Engulfing Bullish Pattern
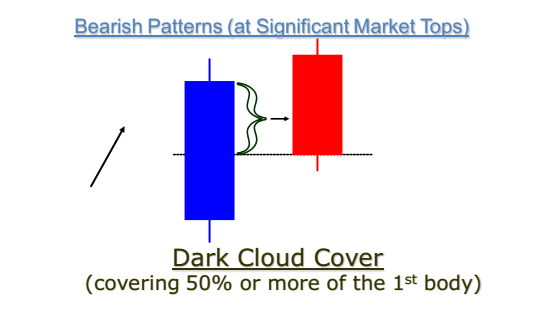
Dark Cloud Cover / Engulfing Bearish
Dark Cloud Cover (Bearish at Market Bottoms)
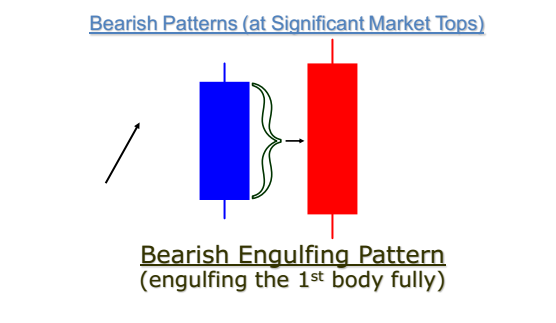
Bearish Engulfing Pattern (Bearish at Market Tops)
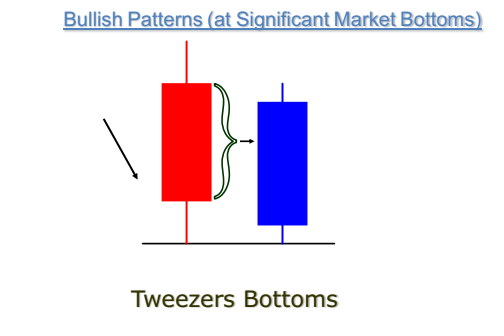
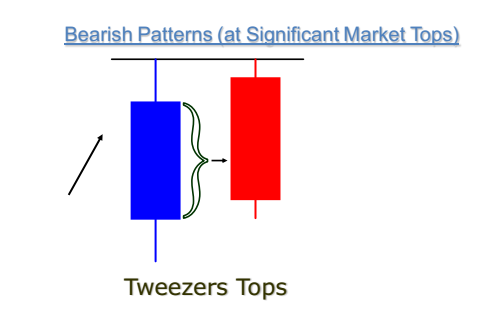
Tweezers Tops / Bottoms (Double Tops / Bottoms)
Tweezers Bottoms (Double Bottoms - Bullish at Market Bottoms)
Tweezers Tops (Double Tops - Bearish at Market Tops)
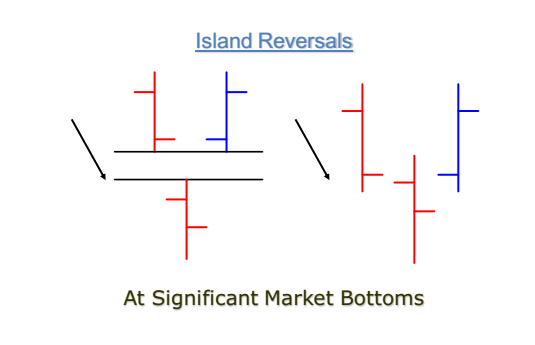
Abandoned Baby Tops / Bottoms (Island Reversals)
Bullish Island Reversals (Bullish at Market Bottoms) - Also termed as Abandoned Baby Bottoms
Bearish Island Reversal (Bearish at Market Tops) –
Also termed as Abandoned Baby Tops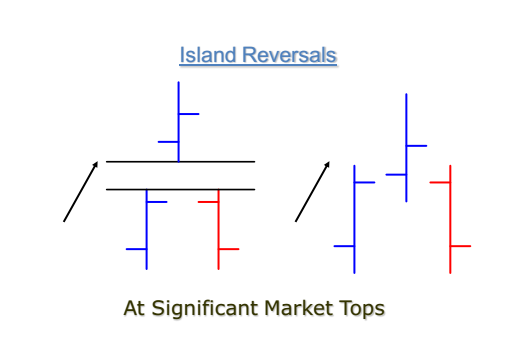
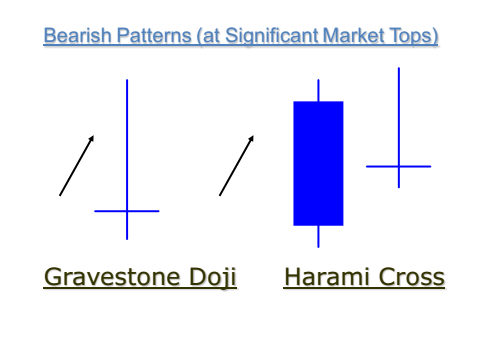
Combinations of Doji (Bearish at Market Tops)
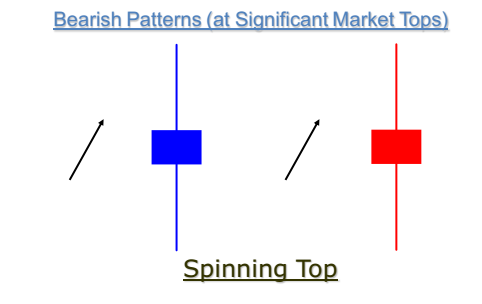
Spinning Tops (Bearish at Market Tops)